


The power of 1 feature: how Airbnb’s 2013 location model transformed search rankings
Why high-quality feature engineering beats the kitchen-sink approach every time.

This week I have been reflecting on all the value I have gotten from scientific papers when applied to work. I don’t think I will ever write a scientific paper, but, I do believe I can share with the Data Science community what I understood from these papers in a more distilled way.
This is why I wanted to share with you my first paper review (actually it was a blog post in The Airbnb Tech Blog) which talks about location relevance at Airbnb. If you want to learn how 1 feature made Airbnb’s search smarter, tag along with me!
Let’s begin!

Where can you find the paper?
This is an old blog post, dating back to 2013, and in later years Airbnb have adopted other techniques to measure location relevance. This deep dive into Airbnb’s 2013 location model highlights how feature engineering outperformed brute-force approaches. I can’t stress enough the importance of really thinking about engineering a specific feature. In other words, it is sometimes much much better to go for low number of features but of high quality than take the ‘kitchen sink’ approach — ie, throw 100 features and see what happens.
Step 1: Why did euclidean distance fail in Airbnb’s location ranking?
The location of an accommodation is sometimes as important as the quality of the accommodation. Quality is easy to measure; you have hotel stars, you have reviews, you have the types of facilities it offers, etc. But location… that is way more difficult to measure.
Euclidean distance failed because it treated all locations as equally accessible, ignoring travel demand, city layouts, and booking behaviour. This led to misplaced ranking results and poor user experience.
💡 Example: A listing 5km away in a straight line might actually be 30 minutes away due to city infrastructure. Yet an Euclidean distance would rank it higher than a closer but more accessible option.
The following screenshot shows the heatmap of how where Airbnb’s listings displayed without any location relevance scoring. As you can see, weird distribution.

Step 2. Airbnb’s exponential decay model for location ranking
I assume the majority of you readers have travelled. I think we can all agree that, in most cases, being close to the center of town is desirable. Airbnb optimised its search algorithm further by prioritising listings near city centers using exponential decay. Conceptually, they thought, “well, let’s give a higher weight to the properties close to the center”. They did this with an exponential demotion curve.

By choosing a certain distance to being the demotion of the location relevance, Airbnb managed to really focus on accommodations closer to the center.

Step 3. How Airbnb’s sigmoid function improved location relevance
The idea here was to combine centrality with a mixture of Airbnb’s supply and the actual city topography. A couple of examples:
If Airbnb was looking to expand to a new location, and they only had some outskirt supply, you wouldn’t want to the model to fully remove that supply or score it ultra low.
Generally, cities are not radially distributed (ie, as if it was a circle). There are bridges, mountains, rivers, etc. So a simple strong exponential decay cannot take this into account.
To be more visually clear, Airbnb showed examples of how their supply was distributed in different cities based on distance to the center.


Airbnb put this into practice with a sigmoid demotion curve, where they could specify an inflexion point. The idea was to provide accommodations within a certain distance, with a ‘similar’ location relevance weight. In addition, the decay after the inflexion point would be smoother. Whilst this yielded positive results in their AB tests, it was difficult to manage at scale as they would need to set a different inflexion point for each city.

Step 4. Beyond geography: Airbnb’s use of conditional probability in location search
Whilst the sigmoid demotion curve was a good starting point, this approach still couldn’t understand things like a neighbourhood being dangerous or not, a neighbourhood not having public transport nearby or a neighbourhood which was primarily an industrial site.
In order to improve Airbnb’s results, they drew on the concept of conditional probability. I am not sure exactly how they implemented it, but this would be my first initial simple approach.

Assume the world looks like this:
As you can see, Airbnb used the idea of using ‘the power of the masses’ — ie, implicitly assuming that if users book a certain neighbourhood a lot when they search for a specific query, then this must be a ‘popular’ neighbourhood. When they applied this solution, their results showed again a positive uplift in their AB test. This is what the conditional probability heatmap looked like for San Francisco.

Step 5. Normalizing Airbnb’s location scores for better search results
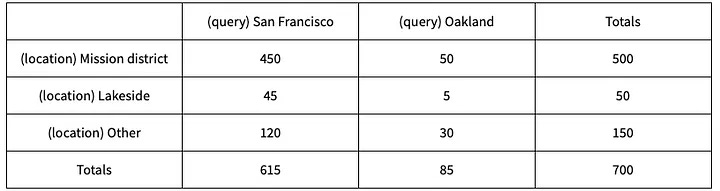
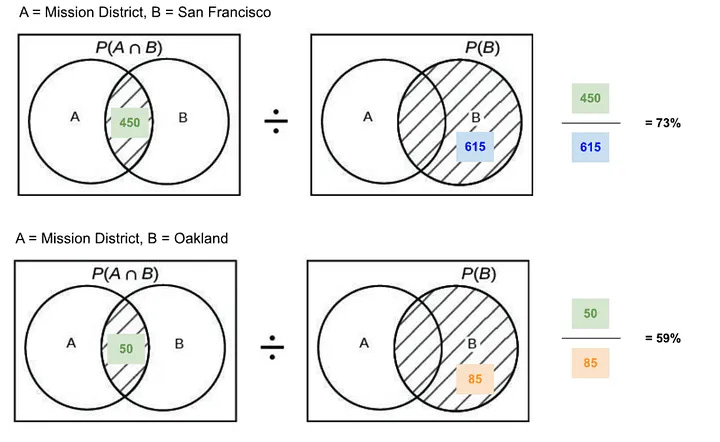
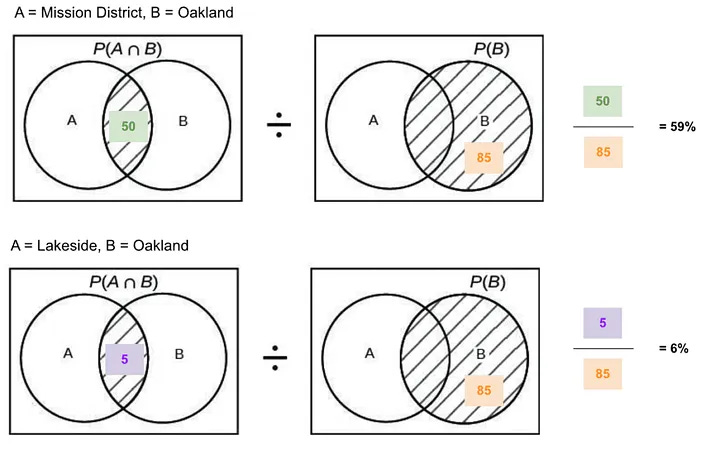
There are several problems with the approach above. For example, we know that position bias is a big problem — extreme example, if for an Oakland query we only displayed San Francisco listings at the top, then by pure bias, most bookings for the Oakland query would come from San Francisco, thus, inflating the conditional probability. See below an example using the numbers in the table provided earlier.

What Airbnb suggested is to normalise the scores by the number of listing in the search area. I really have no idea how they implemented this normalisation as there are multiple ways to do it, but I assume they could have with something as simple as the following.
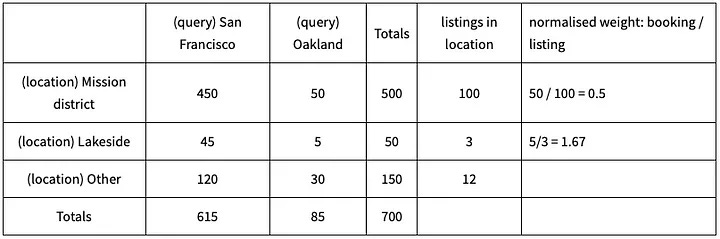
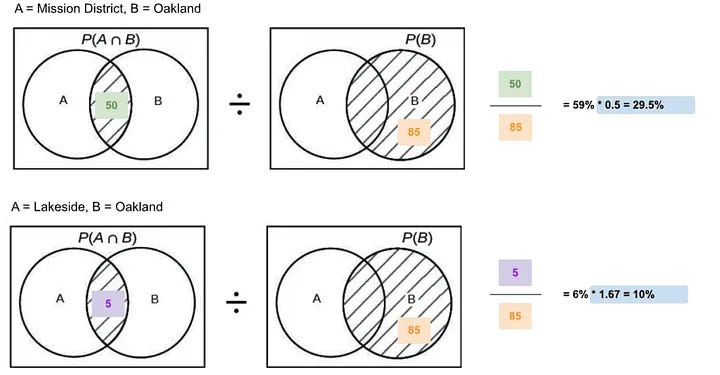
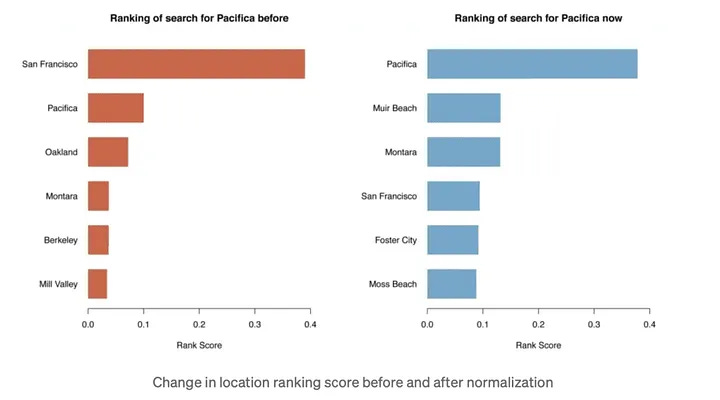
To provide a much better real-life example, this is what Airbnb present in their paper. Prior to the normalisation, the conditional probability weights would have skewed results towards the big cities. After that, the specific query location that the traveller used had a much higher weight.
Step 6. Airbnb’s serendipity factor in location search.
Now, this final step gets complicated. Not too much because of the conceptual solution, but because Airbnb has sometimes so special accommodations that cannot be found elsewhere. As seen before, conditional probabilities mask out the long tails. If it happened with smaller vs larger cities, imagine what would happen for individual properties — no matter how popular they would be.
In their paper, Airbnb mentions the specific example of the mushroom dome.

What happened was that by tightening the normalisation parameters and search queries too much, the mushroom dome disappeared when travellers searched for Santa Cruz, and would have only really found it when looking for Aptos.
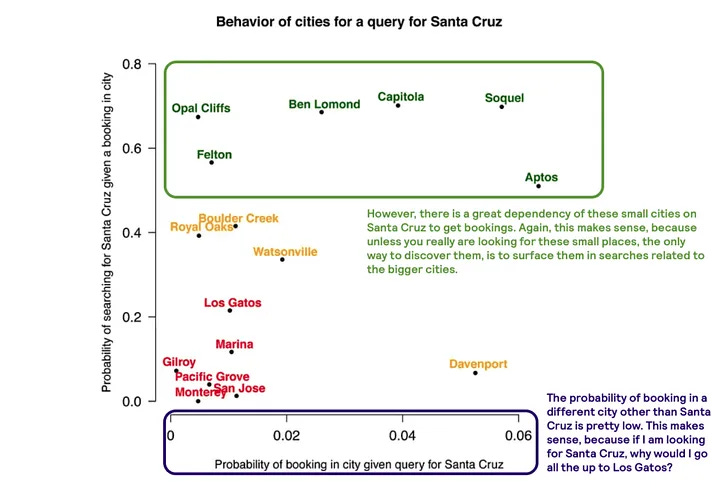
To fix this, they combined 2 conditional probability metrics. My understanding of what they did was try to answer the following 2 questions:
When people search for a specific location L(i), what is the probability of booking in city X(i)
When people are booking in city X(i), what is the probability that they searched for a specific location L(i)
Whilst both questions look pretty similar, the implications of their answers are profound. Let’s explain this with the chart that Airbnb provides.

It seems Airbnb combined the scores from step 5 with the ones from step 6.
The 6 steps summarised
How Did Airbnb Improve Location Relevance in 2013?
In 2013, Airbnb refined its location ranking algorithm using a data-driven scoring system instead of raw geographic distance. The improvements included:
Exponential decay – Prioritised listings near the city center.
Sigmoid function – Balanced search results to avoid penalising outer districts.
Conditional probability – Ranked locations based on user booking behaviour instead of static distances.
Below, you can see a table summarising the 6 techniques they tested.
Key takeaway
As you can see, Airbnb did A LOT of work improving their location relevance signal. This highlights the importance of feature engineering. In the world of deep learning, this feature engineering might be understood by the model on its own, but that is a hypothetical possibility. Therefore, if you need to take anything from this paper is that feature engineering focusing on a specific feature vs trying to extract more and more dimensions, can yield great results.
Further reading
If you are interested in more content, here is an article capturing it and organising it all by topics!

Fascinating breakdown of how one smart feature transformed Airbnb's search - your mushroom dome example perfectly illustrates why pure algorithms need human insight!